Introductory Context
"A candle where Open and Close meet — but not the harmless ‘indecision’ signal most guides claim. Learn when it actually matters."
What Is a Doji Candlestick?
The word Doji comes from Japanese for “simultaneous” — a direct reference to what's actually happening on the chart: the Open and Close prices arrive, for practical purposes, at the same place. Visually, that produces a cross or plus-sign shape: a thin horizontal line where the body should be, with wicks extending into the session's high and low.
Here's the part most explanations skip. A Doji doesn't mean nothing happened during that session. It often means the opposite — price could have swung hard in both directions, testing real strength and real weakness, before landing back exactly where it started. The stillness of the body hides the fact that a genuine battle took place. The wicks are the evidence.
That distinction matters because it changes how you should think about this pattern. A tied scoreboard at the end of a fight between two serious opponents tells you something real about how evenly matched they are right now. A Doji works the same way — but only when serious “opponents” (real trading volume, at a price level that actually matters) were involved in the first place.
• Key Definition
Doji — A candlestick where the Open and Close prices are identical, or close enough that the body is negligible compared to the candle's full range (roughly 5% or less). The result is a thin line rather than a filled rectangle, with wicks showing how far price actually moved before settling back.
Anatomy of the Doji: How to Actually Identify One
Don't rely on eyeballing a chart to decide whether something is a genuine Doji — at typical chart zoom levels, a small real body and a true Doji can look almost identical. Use the numbers instead.
Take the candle's total range (High minus Low) and compare it to the body (the absolute difference between Open and Close). If the body is roughly 5% or less of the total range, it qualifies as a Doji. Above that, even if it looks small, you're looking at a Spinning Top or an ordinary small-bodied candle — a different pattern with different rules.
Worked example: a stock opens at 1,842, trades up to a high of 1,879, down to a low of 1,801, and closes at 1,844. Range = 1,879 − 1,801 = 78 points. Body = |1,844 − 1,842| = 2 points. Body-to-range = 2 / 78 ≈ 2.6% — a genuine Doji. Change the close to 1,847 instead, and the body-to-range jumps to roughly 6.4% — no longer a Doji by this definition, even though the visual difference is tiny.
A second check matters just as much: the wicks need to be real. A candle with almost no body and almost no wicks isn't a Doji expressing indecision — it's usually just a session with very little trading activity behind it (a holiday session, an illiquid stock, a quiet pre-market print). That's a different, much weaker signal, and it's worth being able to tell the two apart.
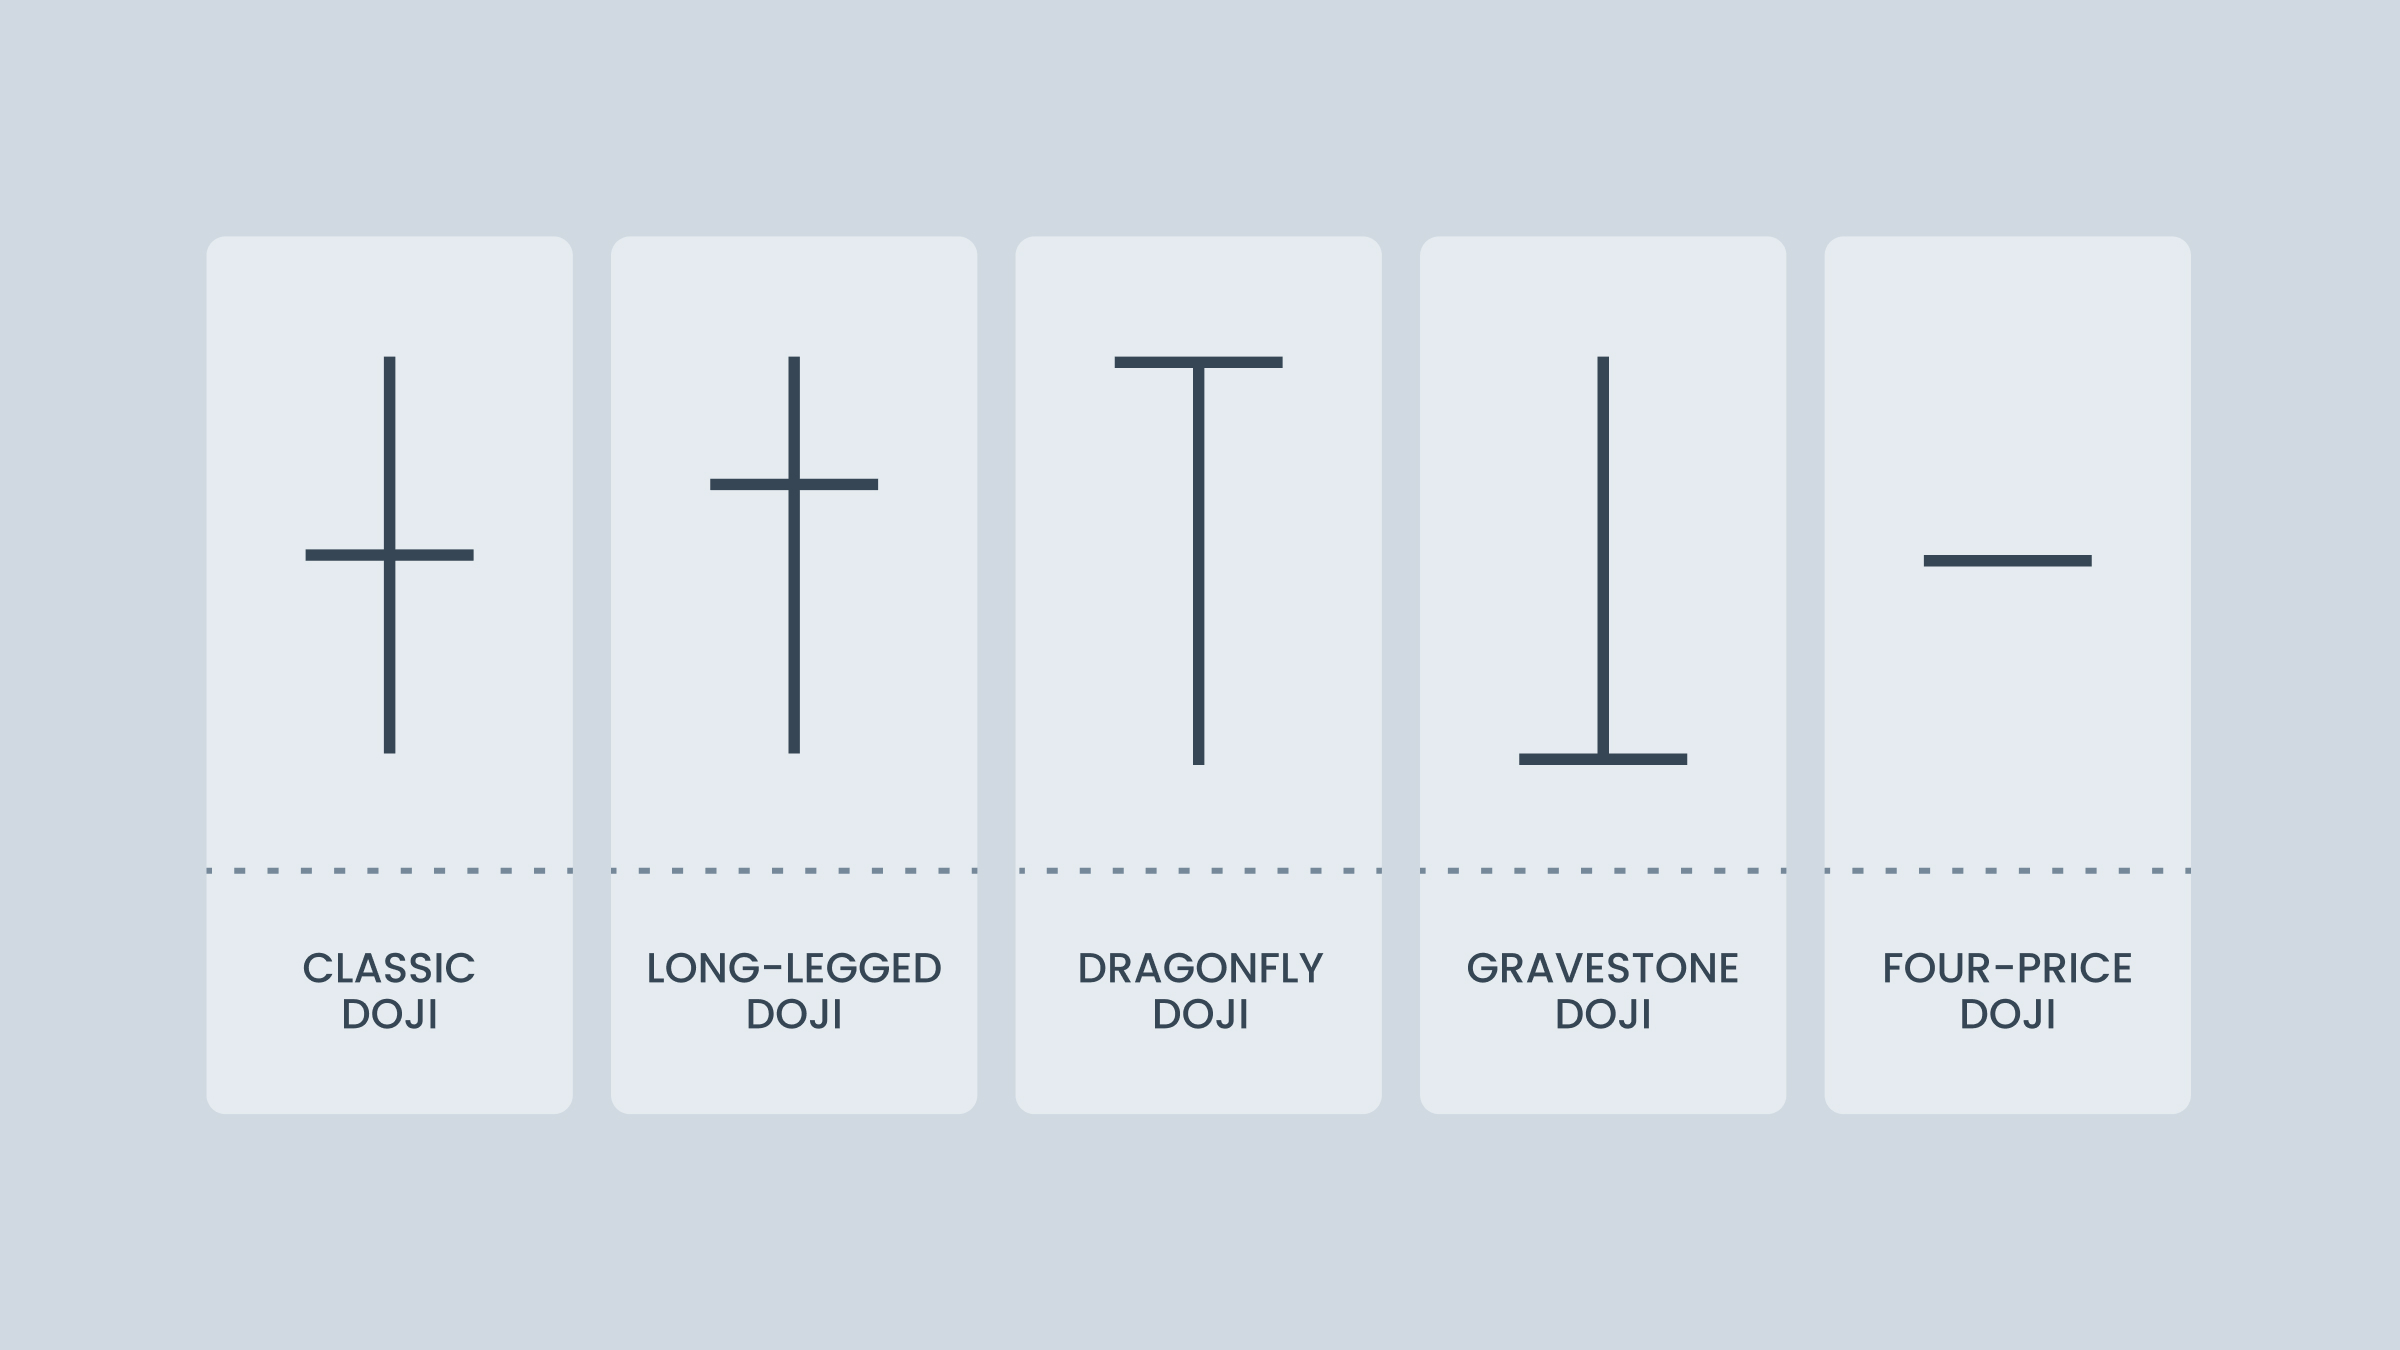
The Four Types of Doji
Not every Doji looks the same, and the differences aren't cosmetic — each one tells a slightly different story about where the fight took place during the session.
Standard (Neutral) Doji — upper and lower wicks are roughly equal. Both sides tested and both were rejected by roughly the same amount. This is pure, unweighted indecision.
Long-Legged Doji — both wicks are present and unusually long. The standoff wasn't just even, it was violent — price swung hard in both directions before settling back near the open.
Dragonfly Doji — a long lower wick with little or no upper wick. All the testing happened below the open; sellers pushed hard, buyers absorbed it completely and dragged price back up. Structurally bullish-leaning.
Gravestone Doji — the mirror image: a long upper wick with little or no lower wick. Buyers pushed, sellers absorbed it all, price fell back down. Structurally bearish-leaning.
None of these four automatically means “buy” or “sell.” Even the Dragonfly and Gravestone, despite their directional lean, still depend entirely on where they show up and what happens next — which is exactly what the rest of this page covers.
The #1 Mistake Traders Make With This Pattern
Seeing a Doji and immediately treating it as a reversal signal. On its own, a Doji is not a buy or sell signal — it's a flag that says “look closer here.” Its meaning is built entirely by three things: where it forms (context), what happens in the session(s) right after it (confirmation), and what other independent signals agree with it (confluence). Skip those three checks, and you're not trading the Doji — you're guessing.
What a Doji Really Tells You About Market Psychology
Picture a session where price opens, buyers push it up as fresh momentum builds, then sellers step in hard enough to not only stop the rally but drive price down through the opening level entirely. Just as things look bearish, buyers step back in, absorb the selling, and drag price back up to close almost exactly where it opened.
That's a Doji — and notice it isn't a quiet session. It's often a full round-trip through real strength and real weakness that happens to land back at the start. The flat body hides genuine volatility, and the wicks are the only visible proof it happened.
Here's why that matters: a tied outcome only tells you something useful if you know who was fighting and where. A Doji that appears after a market has been falling for a week, at a price level that has mattered before, is meaningfully different from the same-looking candle appearing in the middle of an aimless, sideways chop. In the first case, a one-sided contest has suddenly become two-sided — a real shift. In the second, an indecisive market simply produced another indecisive candle — no new information at all.
Volume adds one more layer. A Doji on above-average volume reflects serious capital genuinely fighting on both sides. A Doji on unusually light volume may just mean nobody serious showed up that day — a much weaker version of the same shape.
How to Trade the Doji Pattern
A workable, disciplined approach to this pattern comes down to four steps, applied in order.
1. Check the setup. Look for a genuine prior trend (five-plus sessions moving clearly in one direction) arriving at a location that already matters — a prior swing high or low, a support/resistance zone, a major moving average, or a key Fibonacci level. A Doji forming in empty price space, with no prior significance, is not worth your attention regardless of how clean it looks.
2. Wait for confirmation. Never enter on the Doji candle itself — it hasn't told you which side wins yet. Wait for the next session (or occasionally the one after) to close with a real body in the expected direction, ideally breaking past the Doji's own high or low, on volume that matches or exceeds the Doji's own.
3. Place your stop beyond the wick, not the body. The wick marks the full extent of the standoff — if price trades back through it, the rejection that made the trade attractive has failed. A stop placed just below the body sits inside normal noise and gets triggered by ordinary volatility, which is the single biggest reason traders wrongly conclude this pattern “doesn't work.”
4. Target the next real structural level, and never take the trade if the reward is less than twice your risk. If the nearest resistance or support doesn't offer at least a 1:2 reward-to-risk ratio from your entry, skip the trade — there will always be another setup.
• Pro Tip
Before trusting any Doji, check the higher timeframe. If your Daily-chart Doji agrees with what the Weekly chart is doing, trade it with confidence. If the Weekly chart shows a firmly intact trend with no sign of slowing, treat the Daily signal with real caution — higher timeframes represent more accumulated capital and conviction, and when the two disagree, the higher timeframe usually wins.
A Real-World Example
Consider a large-cap index that has fallen for six straight sessions, arriving directly at its 200-day moving average — a level widely watched by institutional desks. A Doji forms exactly at that average, with RSI reading oversold at 29. The very next session closes with a strong bullish candle, breaking above the Doji's high on volume well above average.
That sequence — a real trend, a meaningful location, a fatigued momentum reading, and genuine confirmation — is what a tradeable Doji setup actually looks like. Compare that to a Doji appearing mid-week inside a flat, three-week sideways range with no clear trend behind it and no notable level nearby: same shape, far less meaning, and not a setup worth risking capital on.
The difference between those two examples isn't the candle. It's everything around the candle — which is the entire point of this page.
Educational Content Only
This page is for educational purposes and does not constitute investment advice or a recommendation to buy or sell any security. Trading involves substantial risk of loss. Past pattern behaviour is not indicative of future results. Always do your own research or consult a licensed financial adviser before trading.